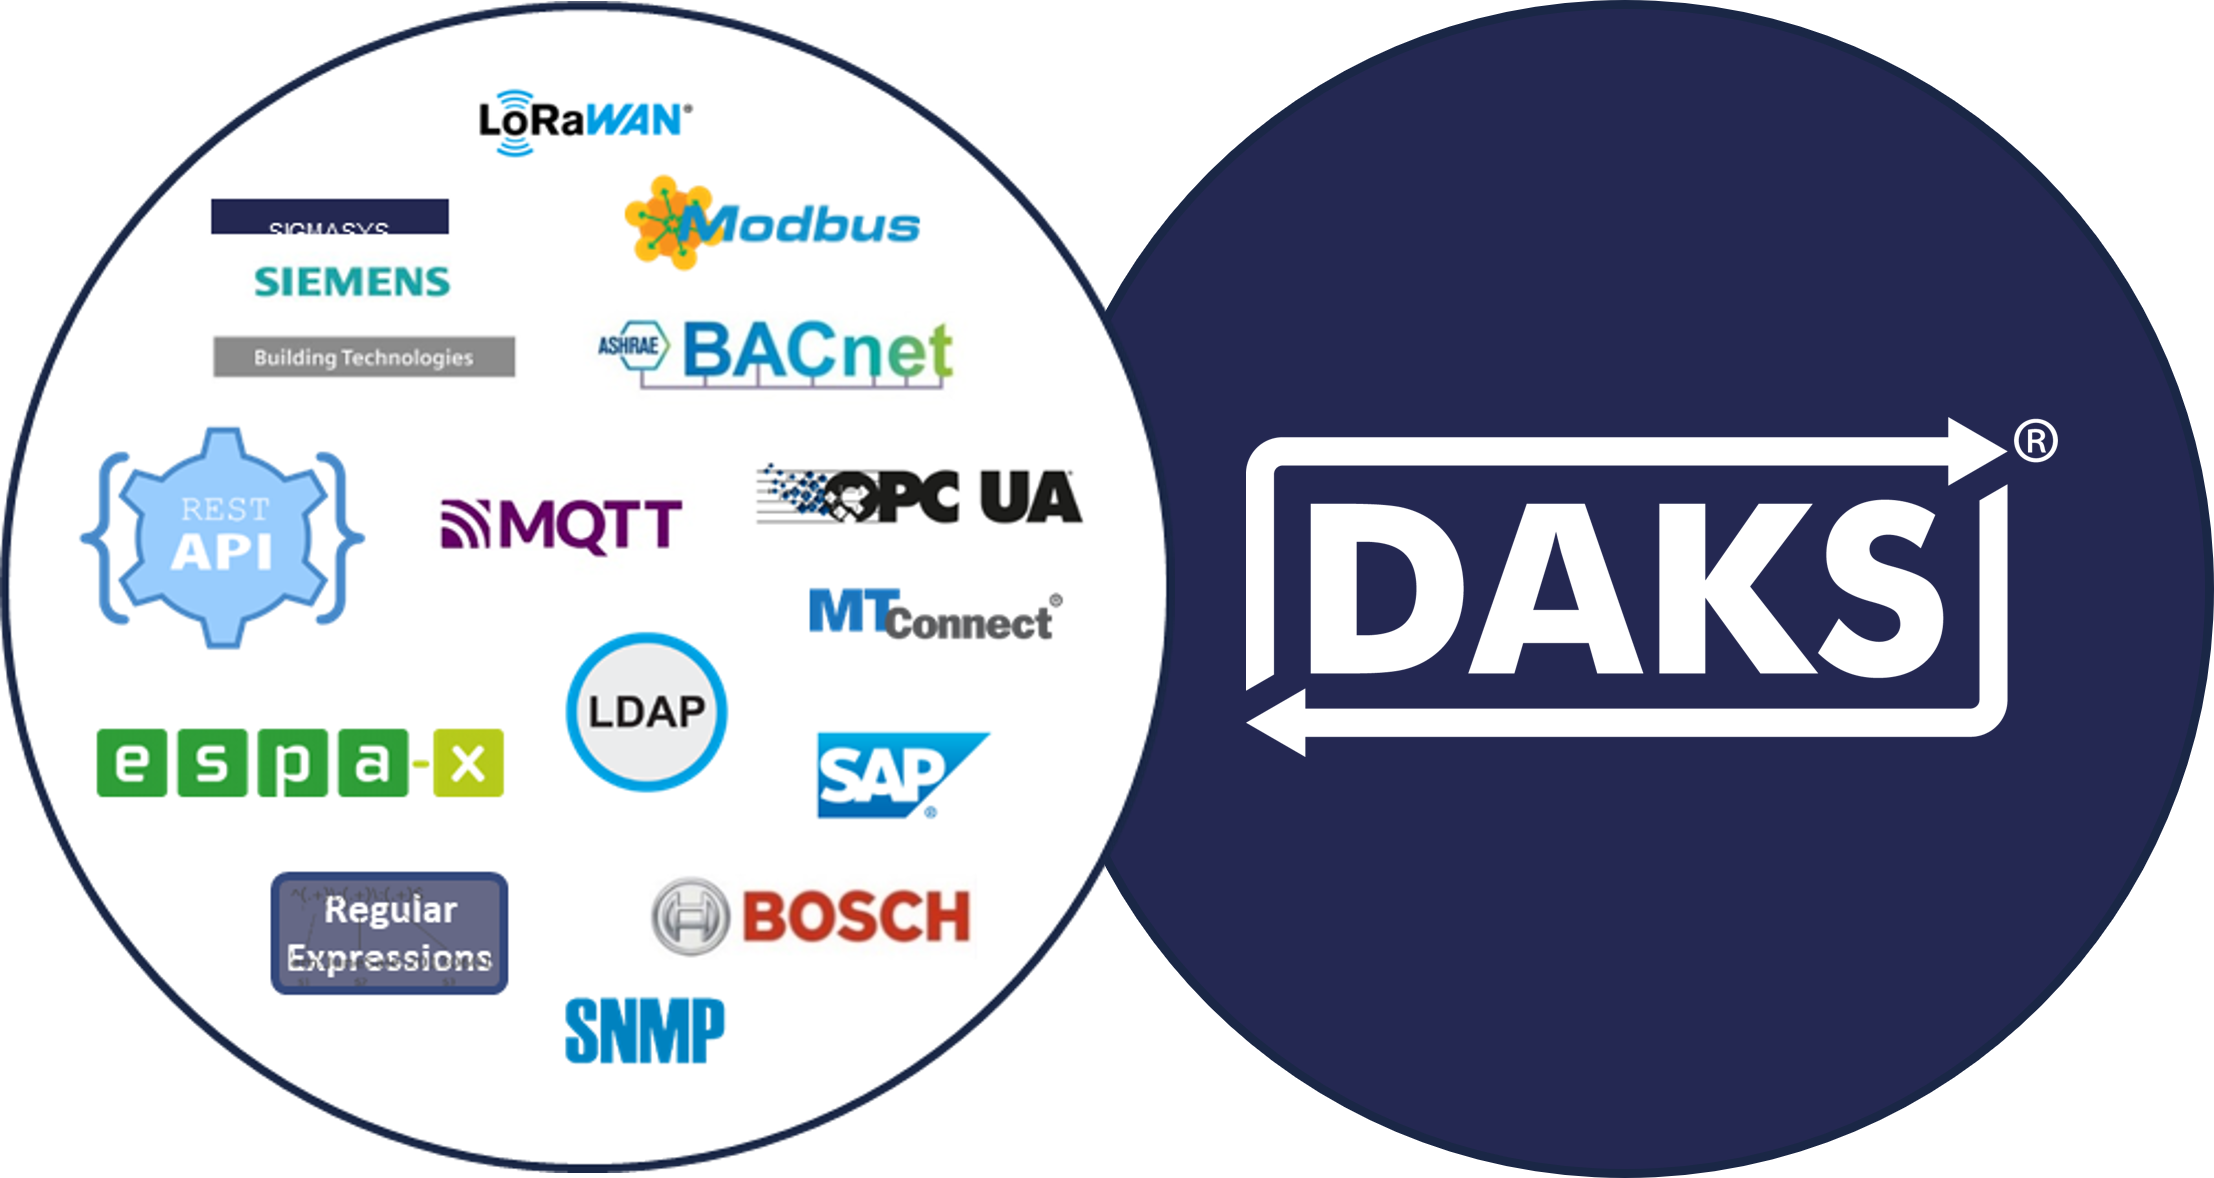
DAKS-IoT connects two important worlds
integrates the networked IoT world of intelligent sensors and machines into the DAKS alarm world. The DAKS alarm server can therefore collect and evaluate data from the Internet of Things, automate processes and trigger alarms or notifications in real time. In combination with DAKS, IoT technologies can be used for safety-critical applications in order to respond quickly to emergencies or faults.
DAKS-IoT is based on the Node-RED visual development environment familiar from many smart applications. This allows various systems, protocols and IoT processes to be connected, automated and visualized without any significant programming effort. However, while Node-RED is known for its simple handling of process flows, not everyone may be aware that Node-RED also enables clear visualization of data and processes with various dashboard functions.
Monitoring provides answers for those responsible
The emergency button has been pressed and the necessary emergency services are informed. Right? But how do you know that the helpers have actually been informed, have accepted the assignment and are on their way? Only when they (hopefully) arrive? Monitoring essential processes such as these is a valuable part of a complete and well thought-out alerting concept – because if I only realize after valuable minutes have passed that no or not enough helpers have arrived and therefore have to be alerted again, it could already be too late to save people or avoid major damage in an emergency.
Whether this concerns a mass casualty incident (MCI) or the summoning of a crisis team or surgical team – if the status can be monitored during the alarm process, valuable time can be saved and any further measures can be taken. Not enough helpers reached during a MCI alarm? More can be alerted. The situation eases and no more helpers are needed after all? The alarm can be canceled prematurely.
For example, after a serious accident with many injured people, a crisis team could trigger an alarm via a button on a dashboard, which mobilizes a team of doctors and other responsible persons in the hospital. While DAKS summons the necessary care team, the members of the crisis team can follow the number of people reached or the acknowledgement status of those called on the dashboard. You can find out how such a scenario might work in detail in our application example 'Trigger and Monitor MCI Alarms Easily'.
Other common use cases for the alarm dashboards include monitoring data from various (machine) sensors and building management systems.

Capture everything important quickly
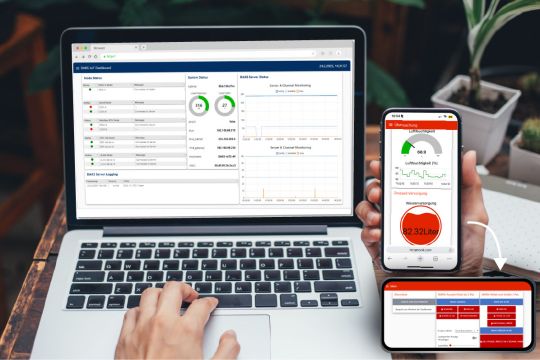
Based on DAKS-IoT, it is not only very easy to build and trigger alarm flows, but also to create visually appealing overviews. Once compiled, the dashboard can be used anywhere and on the move, e.g. on a smartphone or desktop.
The alarm dashboard allows you to see at a glance which interfaces are currently active. For example, you can use specific queries to see how many broadcast calls are currently in progress or how busy the channels currently are. Live results can be easily displayed via the web dashboard.
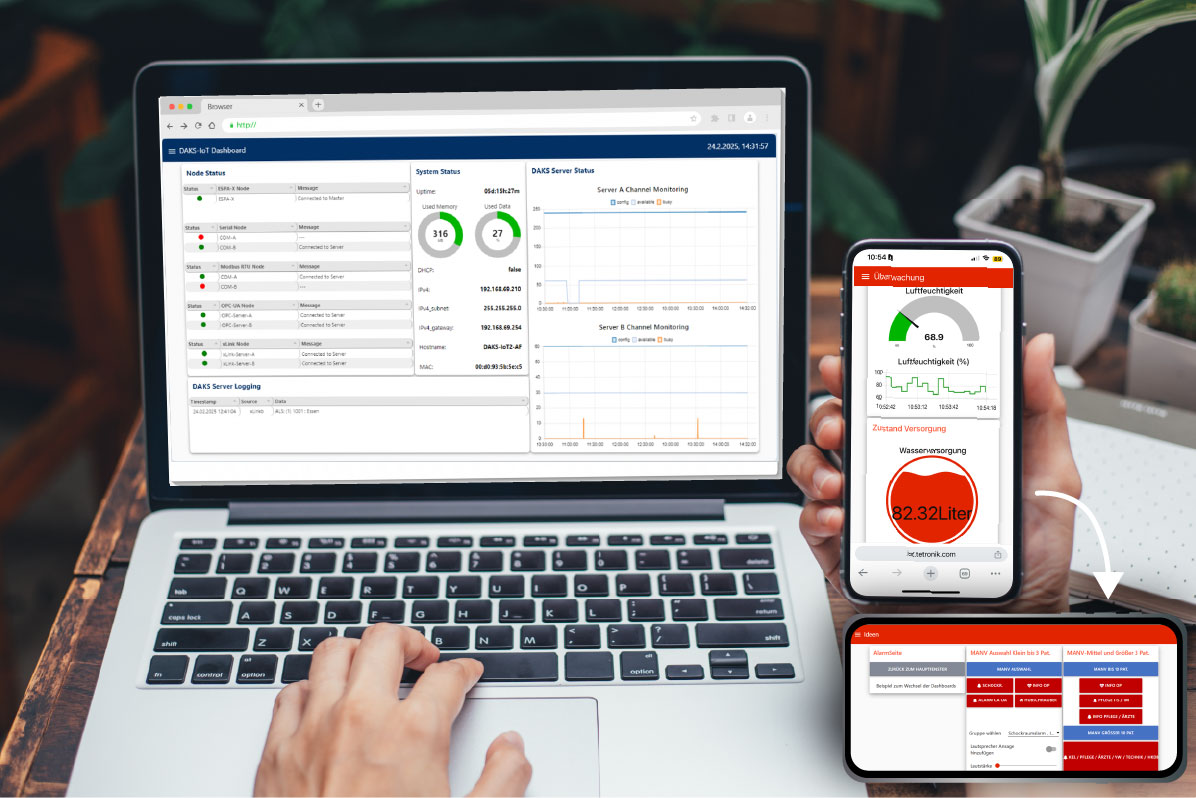
The DAKS-IoT dashboards are browser-based and can be displayed on the desktop or mobile, vertically or horizontally.
Carry out pending actions safely
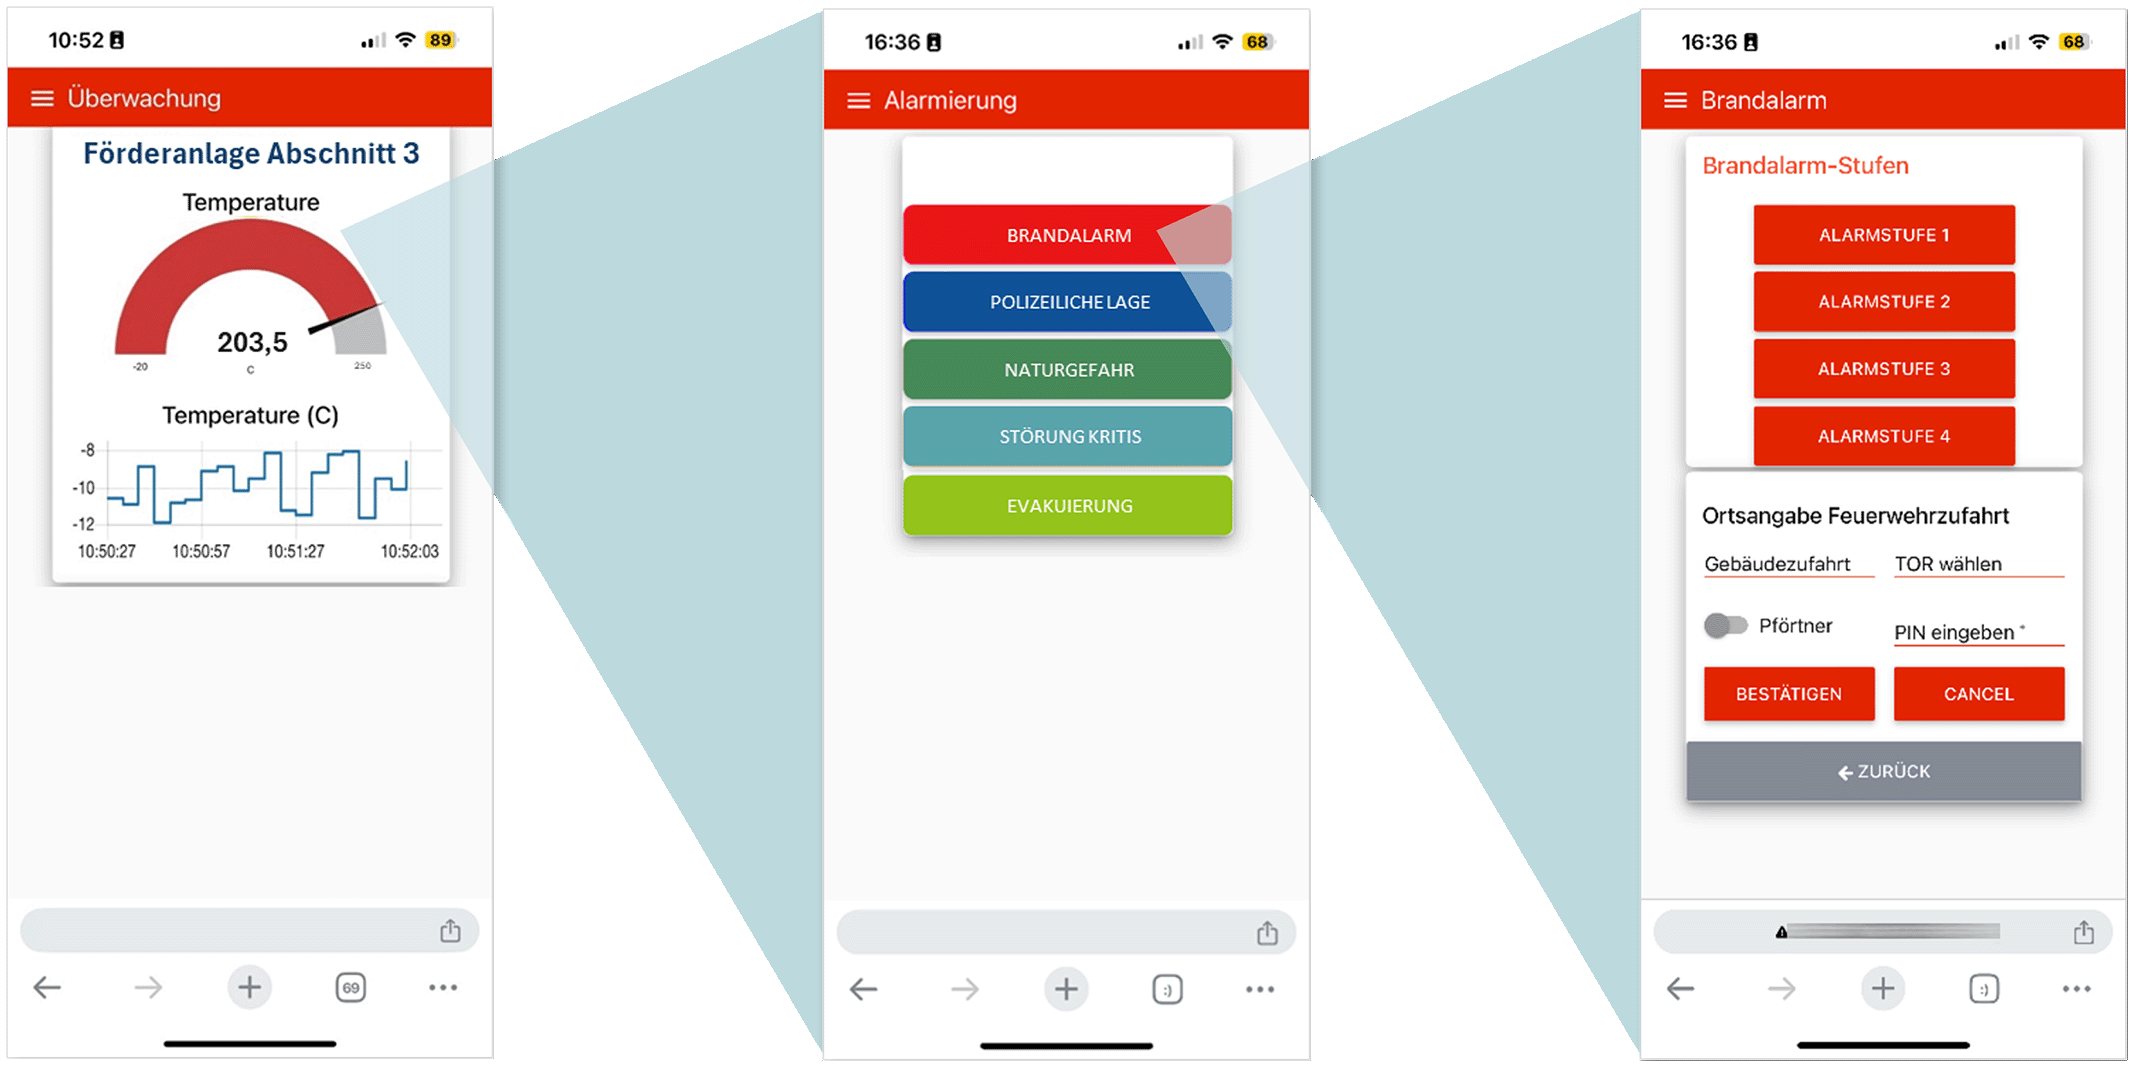
Equipped with all the important information and all the facts at a glance, those responsible can make good, well-founded decisions and initiate appropriate actions. User-friendly and intuitive trigger interfaces complete the alarm dashboards. The buttons for triggering individual actions can be defined, designed, flexibly arranged and combined with input fields as required.
An example of how important a user-friendly look can be in the event of a crisis: If an alarm is triggered via a digital button, it can be made visually apparent that this button has been pressed and that the alarm is actually running (e.g. via the temporary grey coloring of the button). This visible feedback prevents uncertainty and perhaps even double or triple alarms.
Start implementing your alarm dashboard now!
Do you want to preconfigure various scenarios ready to click, integrate all the necessary information sources and make alarm statuses visible at a glance? Your IT system house partner is there for you!


